The average suburb is not your address
Median incomes, crime rates and growth labels can make a map look precise. They still describe an area, not the street, neighbours or routes you will experience.

Chris
Founder
Averages are useful because they turn a complicated place into a number. The same shortcut can become dangerous when the number is treated as a description of the address you are considering. A suburb median income is not the salary of the household next door. A suburb crime rate is not a forecast of what will happen on your street. A growth ranking is not a promise about what the next buyer will pay.
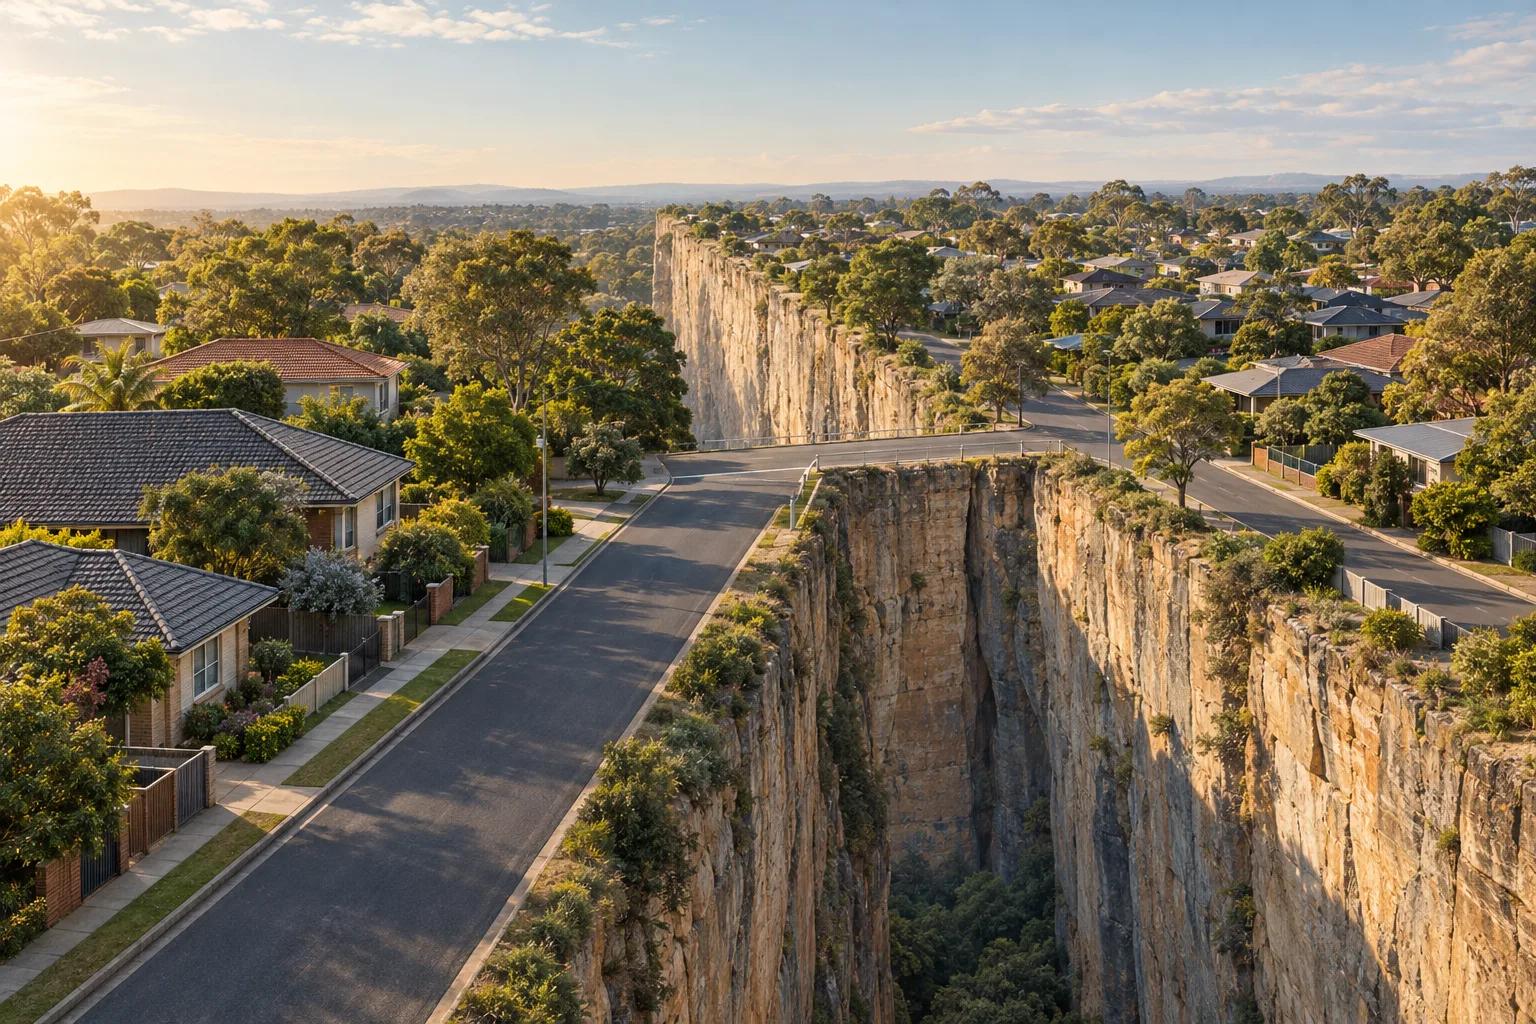
This is the law of averages as a property-search problem. The statistic may be correctly calculated and still answer a different question from the one you need to make a decision. It describes a chosen group, during a chosen period, using a chosen boundary and denominator. Your daily life will happen at a particular front gate, along particular routes, beside particular land uses and among particular neighbours.
What an average can tell you
Suburbs, postcodes and census areas exist partly because public agencies need consistent units for counting and comparison. They also protect privacy. A city suburb can contain thousands of addresses, different housing types, commercial land, schools, parks, busy roads and quiet pockets. One number gives a useful first impression of the group. It cannot remove the variation inside it.
Median income is a good example. A median identifies the middle value in an ordered set. It does not say that most households earn that amount, that the people around a particular property have that income, or that the measure captures business owners, retirees, students, people between jobs and households with more than one income in the same way. Read it as context about a population, not as a description of your future neighbours.
What the area statistic can and cannot tell you
| Location pattern | Potential upside | Potential trade-off |
|---|---|---|
| Median income | Provides a consistent summary for comparing broad populations. | It does not describe the household next door or explain whether retirees, students or business owners shape the result. |
| Crime count or rate | Can reveal reported activity and prompt more specific questions about a place. | The result depends on reporting, police activity, the population denominator, the time period and what happens in busy non-residential places. |
| Fastest growth | May identify a population or dwelling count changing quickly from a small or new base. | A percentage ranking does not explain maturity, services, supply, demand or whether the change supports your decision. |
| Mesh block or SA1 | Offers a more consistent statistical unit than relying only on a suburb name. | Smaller geography still involves privacy protection, limited variables, aggregation and a measurement date. |
| Choropleth map | Makes broad spatial patterns easier to see and compare. | Colour classes and boundaries can imply a sharp, uniform change where the underlying values vary gradually or are driven by one part of the area. |
Crime numbers need a denominator and a setting
A high crime number can feel alarming because the map makes it visible and comparable. Before drawing a conclusion, ask what is being counted, who reports it, which period is shown and what population was used to calculate the rate. Reported offences are not the same as all harm, and recorded numbers can also reflect policing and reporting behaviour.
A shopping centre is an obvious stress test. It can attract workers, shoppers, visitors and evening activity while the rate denominator still relates to residential population. A suburb containing a major retail or entertainment precinct may therefore look different from a quiet residential area even when the statistic is doing exactly what it was designed to do. BOCSAR distinguishes rate maps from hotspot maps and warns that small populations and non-residential activity need careful interpretation.
The opposite mistake is possible too. A new estate may look quiet because the data was collected when few people lived there. A low number from a thin population is not proof of a permanently low-risk place. Treat the number as a prompt to investigate its time period, denominator and physical setting.
Smaller geography is not the same as individual truth
The obvious response to a broad suburb average is to search for a smaller area. That helps only up to a point. The ABS uses Mesh Blocks as building blocks for larger geographies, and most contain roughly 30 to 60 dwellings. SA1s are generally designed around 200 to 800 people. The detail available at each level is shaped by confidentiality, data quality and the need to publish meaningful statistics without identifying households.
A smaller polygon can still be an average. It can also contain a park, warehouse, school, apartment tower or unfinished development that changes the meaning of its denominator. Finer boundaries improve some questions and weaken others. They are a better instrument only when their scale and variables match the decision you are trying to make.
A map can persuade before it informs
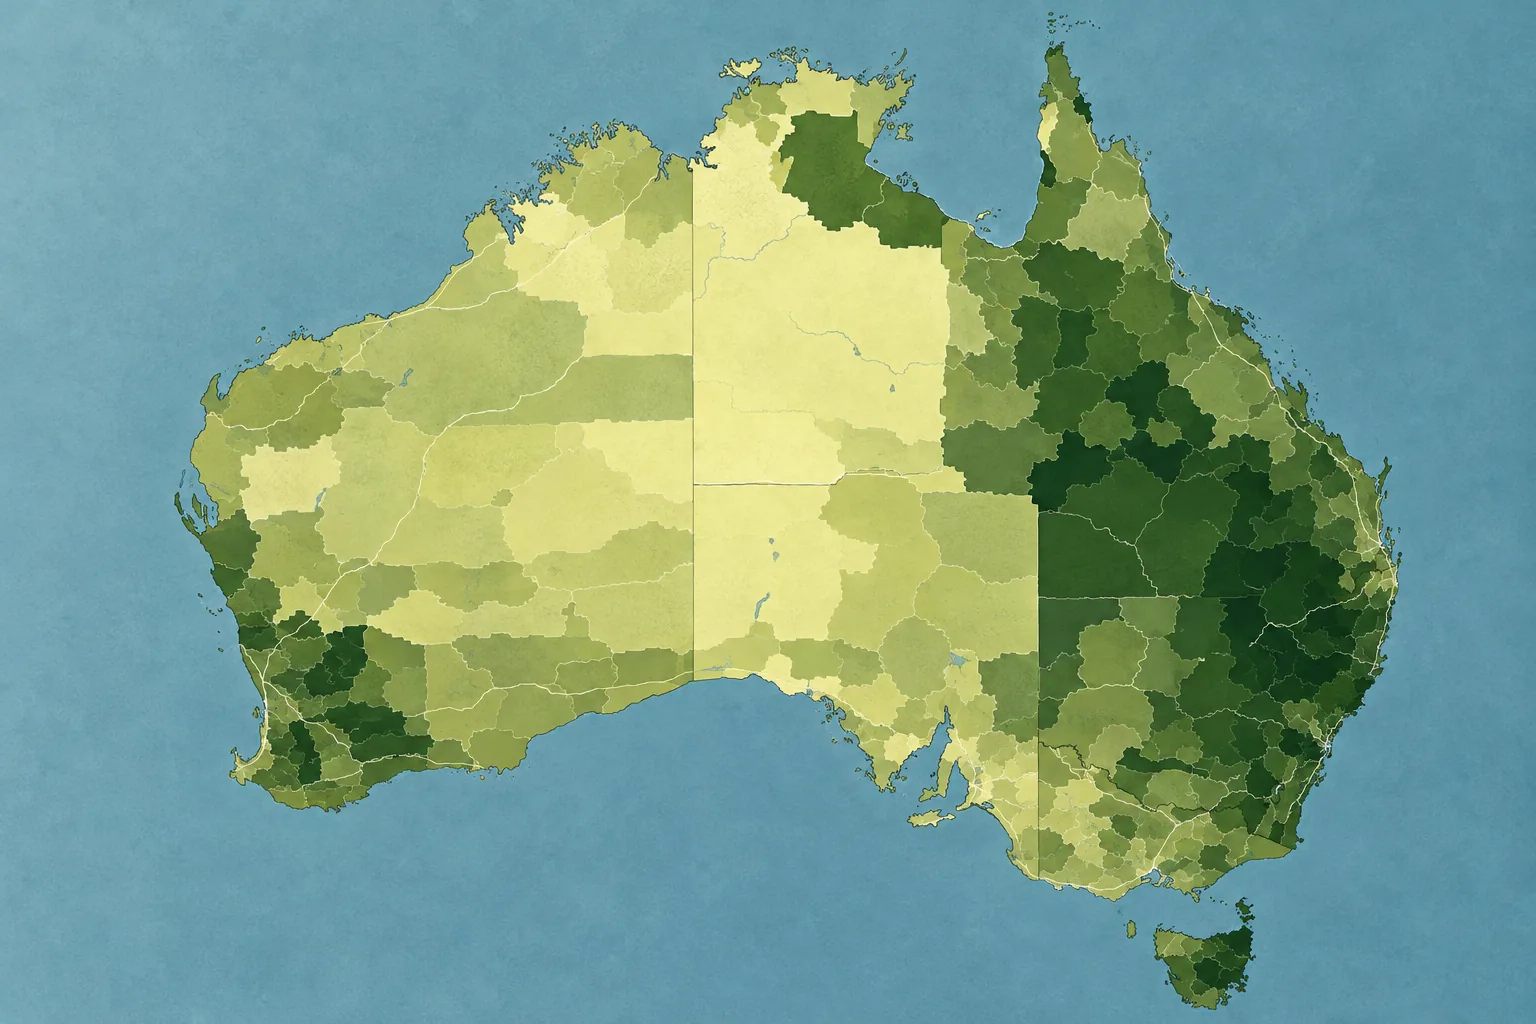
Mark Monmonier's How to Lie with Maps is a useful reminder that maps simplify the world before a reader sees the result. A choropleth map assigns colours to areas, but the apparent pattern depends on the boundary system, classification breaks, colour scale and statistic selected.
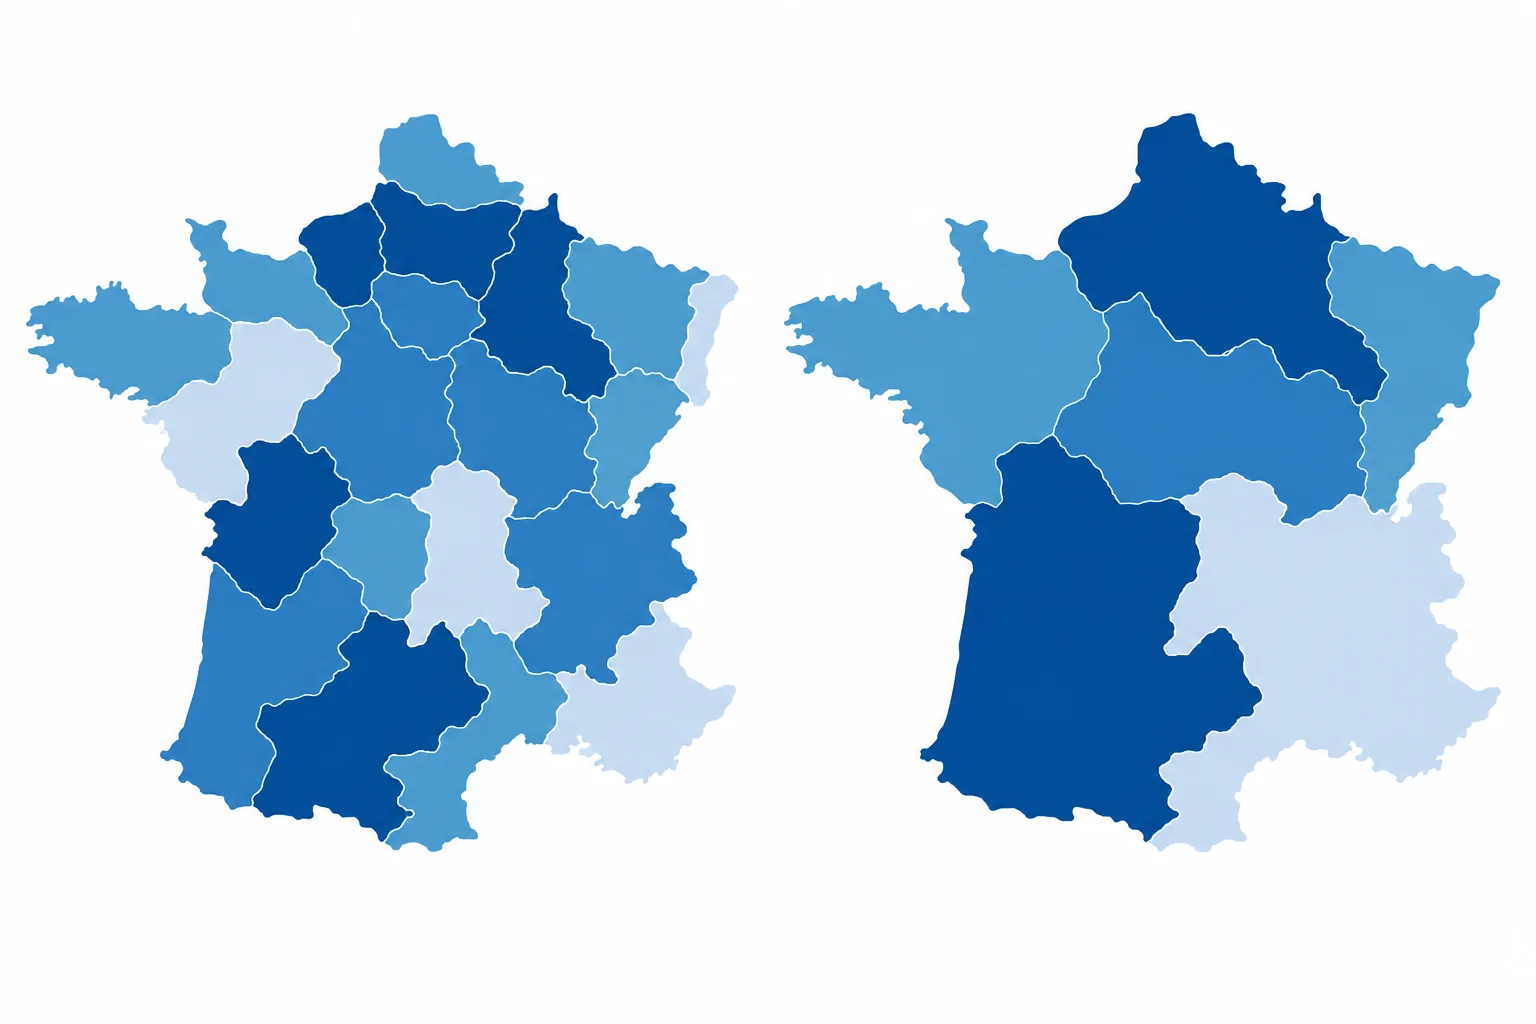
That does not make every map dishonest. It means the map has a point of view built into its construction. A dark shade can invite you to think an area is uniformly high. A boundary can suggest a sudden change. A headline such as “fastest growth” can make a relative percentage feel like a complete account of demand, quality or future value. Ask what has been grouped together and what has been left outside the frame.
Every statistic has a date attached
Census data is a snapshot, not a live feed. The 2026 Census was captured on Tuesday 11 August 2026, but the ABS says processing and quality assurance must happen before the data is published. The first release, covering most topics, is scheduled for June 2027. A second release is planned for October 2027, with the remaining complex data due in early 2028.
That lag is understandable for a large national dataset, but it creates temporal decay. By the time the first results arrive, a suburb may have changed quickly, a new estate may be filling, an older population may be moving in or an employment centre may have opened nearby. The 2026 snapshot will then remain the latest national baseline until the next five-year Census cycle, while the places it describes continue to change.
A report can be information-dense and still be temporally thin. Look for the reference date, the release date and the unit of measurement before treating a number as current. A recent listing page may sit beside an older census profile without making the difference obvious.
The pockets everyone knows about
Ask someone who knows a suburb to name the good and bad pockets. They usually can. They may mention the streets near the station, the homes beside the main road, the older part near the creek, the new estate at the edge, or the pocket that feels different after dark. Their answer is evidence that the suburb is not experienced as a homogeneous unit.
The same applies to income. A low median may reflect a large retiree population, a student precinct or business owners whose personal income is recorded differently from the value created by their enterprise. A high median may sit beside public housing, industrial land or a busy corridor. The immediate neighbours and the surroundings you will use every day matter more to your lived experience than the area's average salary.
Growth labels need their own questions
“Fastest growth” is a relative measure. A small or newly developing area can record a large percentage change from a low base, while an established area changes more slowly because it already contains most of its housing and services. The label can identify momentum. It cannot tell you whether the location has the transport, social fabric, schools, retail, construction quality or resale conditions you care about.
New estates also deserve a time-horizon question. They may offer newer homes and planned amenities, while established areas may offer mature trees, completed services and a known pattern of movement. Neither is automatically better. The point is to avoid turning a growth percentage into a shortcut for quality or future value.
Read the report, then return to the map
People want to get a major purchase right, so a 100-page suburb report can feel reassuring. More information can still create false confidence if every page repeats the same broad boundary and the same dated average. Read the report for clues, then test those clues against the location around the address: routes, edges, land uses, noise sources, services, flood and bushfire context, transport and the conditions your household actually values.
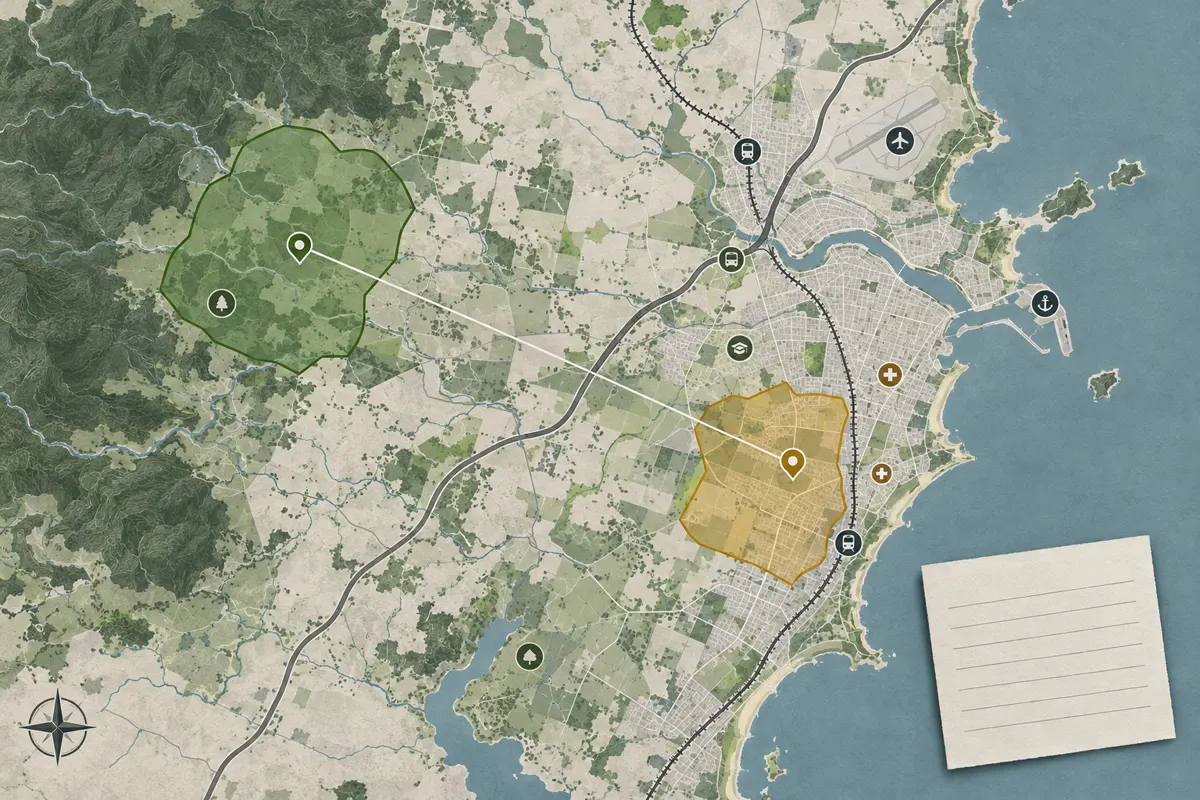
Kaveat is designed for that next step. It lets you define a personal area from requirements and preferences instead of treating a suburb as the answer. You can compare the relationships that matter to your household and see how a signal changes across space. That is different from pretending the map can predict a neighbour, a crime event, a valuation or a future return.
The average can describe the area. Your decision still happens at an address.
Use broad statistics as a useful first layer. Keep their boundary, date, denominator and purpose in view. Then move closer to the decision. The right question is rarely “Is this suburb good?” It is “What does this address ask me to live with, and how does that fit the life I am choosing?”
Sources and further reading
- Australian Bureau of Statistics: Statistical Area Level 1
- Australian Bureau of Statistics: Mesh Blocks
- Australian Bureau of Statistics: QuickStats
- Australian Bureau of Statistics: 2026 Census product guide
- Australian Bureau of Statistics: One week until Census night
- Australian Bureau of Statistics: 2026 Census data release plan
- Australian Bureau of Statistics: Australians come together to complete the 2026 Census
- Australian Bureau of Statistics: Understanding Census geography
- NSW Bureau of Crime Statistics and Research: Using crime statistics
- NSW Bureau of Crime Statistics and Research: Guide for the Crime Mapping Tool
- NSW Bureau of Crime Statistics and Research: Hotspot maps and data
- Mark Monmonier: How to Lie with Maps, Third Edition